

Progress Summary
GCSE progress (value added) – from DfE/Ofsted publication (Raise online)
|
2018
|
2017
|
2016
|
|
| Progress 8/‘Best 8’ |
+0.02
|
+0.11
|
+0.44
|
| English |
-0.13
|
-0.05
|
+0.08
|
| Maths |
-0.02
|
-0.17
|
+0.19
|
| Science |
-0.04
|
-0.09
|
+0.17
|
| Languages |
-1.10
|
+0.02
|
+0.71
|
| Humanities |
+0.24
|
+0.20
|
+0.38
|
| Open Element |
+0.18
|
+0.73
|
+0.98
|
Value added comparisons to 2016 - a score of ‘1000’ is in line with expected progress
Value added comparisons in 2017/18 - a score of ‘0’ is in line with expected progress
Attainment - A' Level Summary
A' Level Attainment (National Average)
|
2018
|
2017
|
2016
|
|
| Academic Average Score |
28.51 (33.66)
|
29.05 (31.65)
|
28.04
|
| Academic Progress |
-0.04
|
-0.06
|
0
|
| Academic Programme Completion |
94.3%
|
100%
|
97.6%
|
| Vocational Average Score |
33.42 (28.47)
|
41.56 (39.6)
|
39.76
|
| Vocational Progress |
-0.01
|
0.07
|
0.14
|
| Vocational Programme Completion |
88.9%
|
80%
|
80%
|
Attainment - GCSE Summary
GCSE Attainment (raw results - from DfE/Ofsted publication)
(Figures in brackets are the latest national average scores)
|
2018
|
2017
|
2016
|
|
| Basics (C+ E/M) (4+English and Mathematics) |
75 (63)
|
66 (63)
|
75 (62)
|
| 5+ English and Mathematics |
45 (43)
|
42 (43)
|
75 (63)
|
| Attainment 8/ Capped points |
50.3 (46.5)
|
47.6 (46)
|
55.7 (49.3)
|
| EBacc (4+ 2018) |
29 (24)
|
33 (24)
|
43 (24)
|
| EBacc (5+ 2018) |
13 (17)
|
28 (20)
|
|
| Basics (C+ E/M) (4+E+M) |
75 (63)
|
66 (63)
|
75 (62)
|
2018 Performance and Attainment Detail
The performance data for Branston Community Academy can also be found online here:
https://www.compare-school-performance.service.gov.uk/school/136358
Progress Summary
GCSE progress (value added) – from DfE/Ofsted publication (Raise online)
|
2017
|
2016
|
2015
|
|
| Progress 8/‘Best 8’ |
+0.11
|
+0.44
|
1039
|
| English |
-0.05
|
+0.08
|
1001.8
|
| Maths |
-0.17
|
+0.19
|
1002.8
|
| Science |
-0.09
|
+0.17
|
1001.8
|
| Languages |
+0.02
|
+0.71
|
1000.1
|
| Humanities |
+0.20
|
+0.38
|
1003.4
|
| Open Element |
+0.73
|
+0.98
|
NA
|
Value added comparisons to 2015 - a score of ‘1000’ is in line with expected progress
Value added comparisons in 2016/17 - a score of ‘0’ is in line with expected progress
Attainment - A' Level Summary
A' Level Attainment (National Average)
|
2017
|
2016
|
|
| Academic Average Score |
29.25 (31.65)
|
28.04
|
| Academic Progress |
-0.06
|
0
|
| Academic Programme Completion |
100%
|
97.6%
|
| Vocational Average Score |
41.56 (39,6)
|
39.76
|
| Vocational Progress |
0.07
|
0.14
|
| Vocational Programme Completion |
80%
|
80%
|
Attainment - GCSE Summary
GCSE Attainment (raw results - from DfE/Ofsted publication)
(Figures in brackets are the latest national average scores)
|
2017
|
2016
|
2015
|
|
| Basics (C+ E/M) (4+English and Mathematics) |
66 (63)
|
75 (62)
|
71
|
| 5+ English and Mathematics |
44 (39)
|
||
| Attainment 8/ Capped points |
47.6 (49.3)
|
55.7 (49.3)
|
351 (308)
|
| EBacc (4+ 2017) |
33 (24)
|
43 (24)
|
34 (24)
|
| EBacc (5+ 2017) |
428(20)
|
||
| Basics (C+ E/M) (4+E+M) |
66 (63)
|
75 (62)
|
71
|
2017 Performance and Attainment Detail
The performance data for Branston Community Academy can also be found online here:
https://www.compare-school-performance.service.gov.uk/school/136358
Progress Summary
GCSE progress (value added) – from DfE/Ofsted publication (Raise online)
|
2016
|
2015
|
2014
|
|
| Progress 8/‘Best 8’ |
+0.44
|
1039
|
1022
|
| English |
+0.08
|
1001.8
|
1001.7
|
| Maths |
+0.19
|
1002.8
|
1001.7
|
| Science |
+0.17
|
1001.8
|
1001.2
|
| Languages |
+0.71
|
1000.1
|
1001.3
|
| Humanities |
+0.38
|
1003.4
|
1003.8
|
Value added comparisons to 2015 - a score of ‘1000’ is in line with expected progress
Value added comparisons in 2016- a score of ‘0’ is in line with expected progress
Progress 8 (headline measure) represents progress in top 10% of all schools nationally
Attainment - A' Level Summary
A' Level Attainment (raw results)
|
2016
|
2015
|
2014
|
|
| % A*-E grades |
98.9 (98.1)
|
99.6
|
99.5
|
| % A*-A (A-level) |
20
|
21
|
17
|
| %A*-A (vocational) |
64
|
78
|
69
|
| Points per entry (A-level) |
216
|
205
|
203
|
| Points per entry (vocational) |
233
|
245
|
245
|
Attainment - GCSE Summary
GCSE Attainment (raw results) - from DfE/Ofsted publication (Raise online)
(Figures in brackets are the latest national average scores)
|
2016
|
2015
|
2014
|
|
| Basics measure (A*-C in E + M) |
75
|
71 (58)
|
60
|
| Attainment 8/ ‘Best 8’ |
55.7 (49.3)
|
351 (309)
|
325
|
| English Baccalaureate |
43 (24)
|
34 (24)
|
32
|
Student's achievements in 2015 public examinations shows considerable improvement generally. Given the fact that GCSE examination performance in 2014 resulted in a national award for excellence in progress made by students this is great news.
|
2015
|
2014
|
2013
|
|
| 5A*-C (inc E/M) |
71
|
59 (55)
|
71 (59)
|
| Attainment 8/ 'Best 8' results |
352
|
325 (307)
|
356 (338)
|
| English Baccalaureate |
32
|
32
|
37 (22)
|
| English av points |
41.5
|
40.7 (38.7)
|
40.8
|
| Maths C+/av points |
42.0
|
39.3 (38.0)
|
42.0
|
A' Level Attainment (raw results)
(Figures in brackets are national average scores)
|
2015
|
2014
|
2013
|
|
| % A*-E grades |
99.6 (98.2)
|
99.5
|
100
|
| % A*-B grades |
64
|
57
|
66
|
| Points per entry |
232
|
226
|
232
|
| Points per entry (academic) |
221
|
220 (223)
|
230
|
| Points per entry (vocational) |
246
|
246 (229)
|
247
|
Examination Data - Progress
(Measures progress made by students across the curriculum)
Key Stage 2 to 4 Value Added Summary Report by Ebacc Area
KeyStage 2 to 4 Value Added Scores for Best 8 and Ebacc Subject Areas
Students' achievements were so strong in 2014 that it resulted in a national award for progress in GCSE examinations.
The Department for Education’s (DfE) analyses of students’ achievements in examination results this summer (RAISE online) have just been released (5/12/14)
How well students achieve at a particular school is compared to a national average. Below is a table that shows how well students at Branston achieved in academic courses (as defined by the DfE) in 2014:
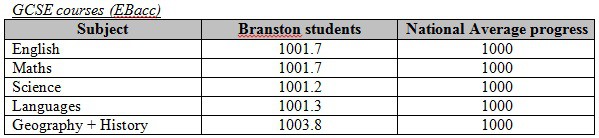
It is unusual for all courses at a school to be above the national average of 1000, it is very unusual for students’ achievements to be so strong that all the courses are above 1001. This is progress well beyond (significantly beyond) expectations.
Disadvantaged students
The table below shows how well our ‘disadvantaged’ students (who have access to ‘pupil premium’ funding from the government) achieved in external examinations in 2014.
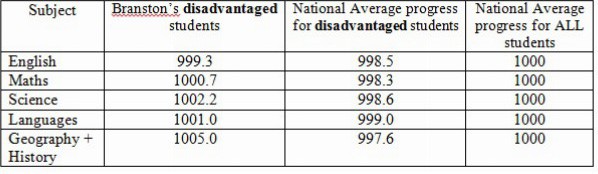
In four of the five courses there was no gap in achievement. Branston’s ‘disadvantaged’ students made better progress than the national average progress of ALL students.
In all five courses Branston’s ‘disadvantaged’ students made more, and usually much more, progress than ‘disadvantaged’ students nationally.
Other important achievement indicators
- 59% of students achieved at least 5 high grade GCSE passes including English and Maths (national average = 55%)
- 32% of students gained the English Baccalaureate - high grade passes in each of English, Maths, Science, a Language, History or Geography (national average = 24%)
- 77% of students made at least expected progress in English (national average = 70%)
- 72% of students made at least expected progress in Maths (national average = 65%)
Other GCSE courses
We are really proud that our students achieve so well across the whole curriculum. In 2014 our students performed beyond or usually well beyond expectations (achievement was significantly positive) in ALL of these courses:
Art
Business Studies
DT
Food
Music
PE
Performing Arts
RE
6th form
Once again (fifth year in succession) our Y13 students’ examination results showed that they made more progress than expected – value added is ‘positive’. These are first class achievements by our 6th form students because the targets set for them are extremely challenging due to their excellent performance in GCSE courses.